Data in this visualization comes from the 2024 Annual Utility Decarbonization Report
The 2024 Utility Decarbonization Index
Electric utilities and the power sector in the U.S. are crucial for averting climate change, especially as electricity demand rises. But how do the nation’s largest electricity producers compare on the necessity of decarbonization?
In partnership with the National Public Utilities Council, we present the 2024 edition of our Annual Utility Decarbonization Index. The index uses the latest available data to track the decarbonization progress of the 47 largest investor-owned utilities (IOUs) in the United States.
The Index Ranking
The 47 IOUs featured in the Index are the largest private electricity producers in the U.S., accounting for over two-thirds of the nation’s electricity generation in 2022. As a result, these utilities’ decarbonization efforts will significantly impact the 33% of U.S. emissions that come from the power sector.
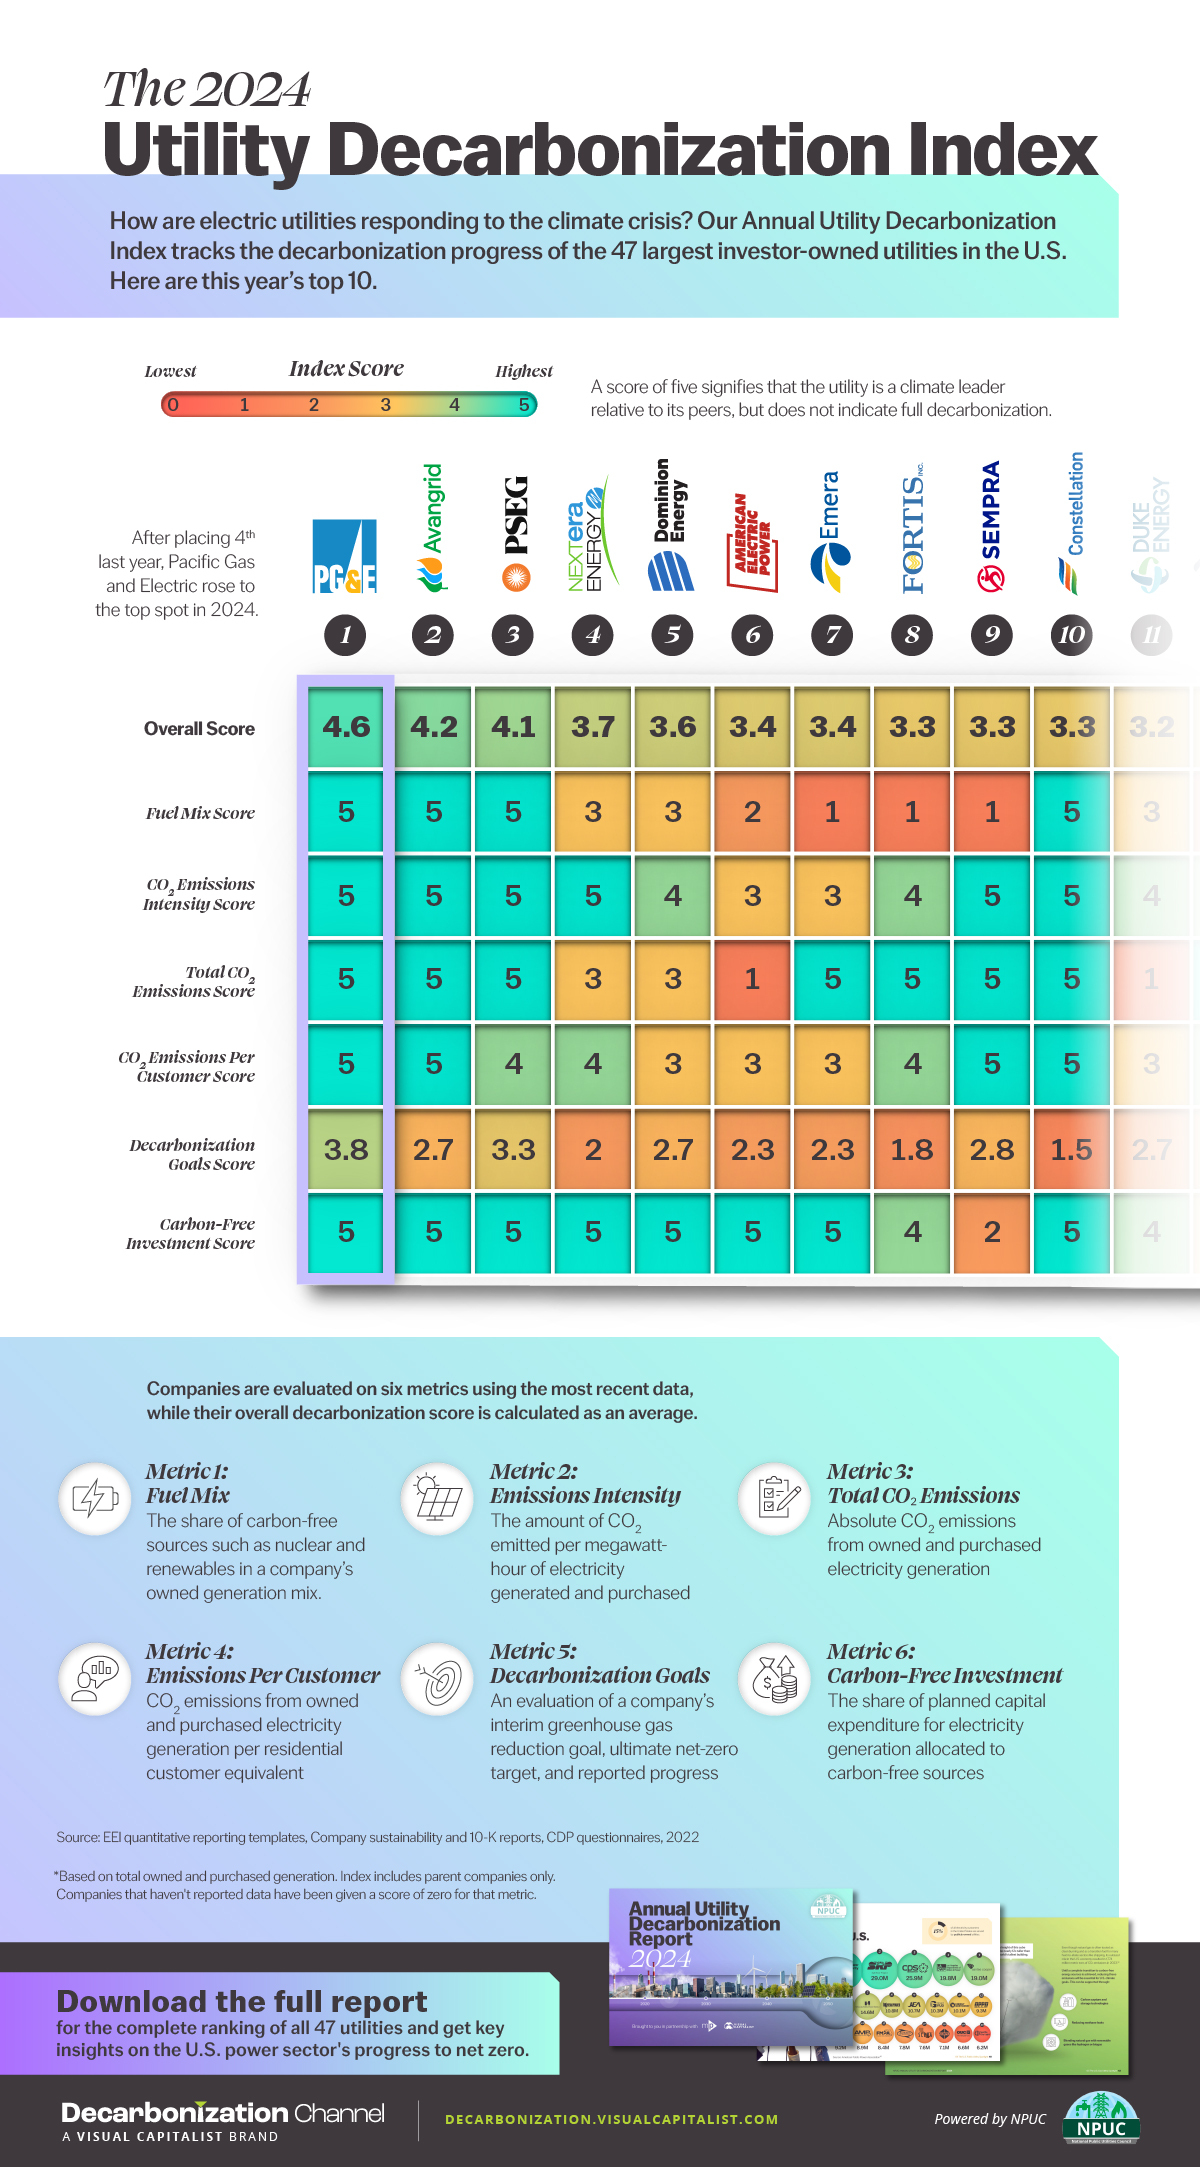
A score of five signifies that the utility is a leader in decarbonization compared to its peers. It does not mean that the utility has fully decarbonized or achieved net-zero emissions.
Here are the top 10 IOUs in this year’s ranking:
RankCompanyDecarbonization Score
#1Pacific Gas and Electric4.6
#2Avangrid4.2
#3Public Service Enterprise Group4.1
#4NextEra Energy3.7
#5Dominion Energy3.6
#6American Electric Power3.4
#7Emera3.4
#8Fortis3.3
#9Sempra3.3
#10Constellation Energy3.3
After placing fourth last year, Pacific Gas and Electric is now #1 in the Annual Utility Decarbonization Index, thanks to significant improvements in fuel mix and emissions per customer.
The second and third-place utilities in this year’s Index, Avangrid and Public Service Enterprise Group, also greatly improved their emissions per customer figures from 2021–2022.
How Does The Index Work?
The Decarbonization Index uses the following six metrics to compare the current environmental efforts of the largest investor-owned utilities:
1. Fuel Mix
The share of carbon-free sources such as nuclear and renewables in a company’s owned generation mix.
2. CO2 Emissions Intensity
The amount of CO2 emitted per megawatt-hour of electricity generated and purchased.
3. Total CO2 Emissions
Absolute CO2 emissions from owned and purchased electricity generation.
4. CO2 Emissions Per Customer
CO2 emissions from owned and purchased electricity generation per customer.
5. Decarbonization Goals
An evaluation of a company’s interim greenhouse gas reduction goal, ultimate net-zero target, and reported progress.
6. Carbon-Free Investment
The share of planned capital expenditure (CAPEX) for electricity generation allocated to carbon-free sources.
All 47 IOUs in the Decarbonization Index are scored on a scale of 0-5 for each of the six metrics. A utility’s final decarbonization score is the average of the six metrics.
The 2024 report assigns a score of zero where numbers are unreported to emphasize the importance of sustainability reporting.
Data for the index was pulled from company sustainability reports, quantitative ESG reporting templates from the Edison Electric Institute, and the Climate Disclosure Project’s Climate Change Questionnaire filings.
Download the 2024 Annual Utility Decarbonization Report
In addition to the Decarbonization Index, there’s much more in the 2024 report, including:
Inflation Reduction Act impacts
Market trends
Year-to-year progression from the previous index
Fuel mix rankings for the largest U.S. public utilities
Gas utility emissions rankings
Are you interested in seeing the rest of the rankings? Download the 2024 NPUC Annual Utility Decarbonization Report and find out everything you need to know about the clean energy transition of the U.S. power sector.
The post The 2024 Utility Decarbonization Index appeared first on Visual Capitalist.